
Looking for a free lunch? Consider putting carbon in your portfolio.

The Nobel Prize laureate, economist Harry Markowitz, is reported to have said, “diversification is the only free lunch” in investing. His seminal work in portfolio optimisation in 19521 highlighted that assets with low correlations can reduce portfolio volatility. In other words, for a given level of risk, adding uncorrelated assets to a portfolio can potentially increase expected returns.
Finding low correlation assets can be a challenge. Bonds and equities traditionally have low correlations, making them the starting building blocks for portfolio construction. Commodities also have a low correlation with bonds, making them another great candidate to add to a portfolio.
Carbon markets are also a low-correlation asset (that is, they have low correlations to equities, bonds and commodities) that can help in the optimisation of portfolios.
What are carbon markets?2
Regulated or compulsory carbon markets are mechanisms that governments have implemented to provide a market-based solution to their decarbonisation efforts. In these mechanisms (so-called Emission Trading Systems or Cap and Trade systems) governments set maximum greenhouse gas emissions caps and issue allowances to firms operating in the various industries covered by their schemes. At the end of a compliance year, the firms must surrender enough allowances to cover their emissions produced during the year. These allowances are tradable in the secondary market (before surrendering them to the government), allowing firms that find decarbonisation expensive and difficult to buy more allowances, and firms who find it easier to decarbonise to monetise their allowances. By design, as the caps fall each year, the government-set emissions will fall. The allocation of that cut in emissions is efficient, as it is borne by the firms facing the lowest cost of abating.
Alongside a secondary market in these allowances, there are futures markets on allowances. The futures markets can be used by commercial hedgers and investors/speculators alike. Carbon allowance futures are an emerging asset class.
The two largest carbon markets in the world are the European Union Allowances and the California Cap and Trade market. Together they accounted for over 90% of the value in global carbon markets in 20223.
Low correlations
Looking at these two carbon markets, we can see a very low correlation between them and traditional asset markets: equities, bonds and commodities (Figure 1). EU Allowances (EUAs) have a particularly low correlation with other assets. California Carbon Allowances (CCAs) have a slightly higher correlation with US and global stocks, but still considerably lower than the correlation between broad commodities and these two equity markets.
Surprisingly, the correlation between EUAs and CCAs is very low at 0.23. That compares to a correlation of 0.74 between S&P 500 (a US equity benchmark) and MSCI Europe (a European Benchmark). Such low correlations indicate that both carbon markets could be considered simultaneously as options to make a portfolio more efficient.
Figure 1: Correlation matrix
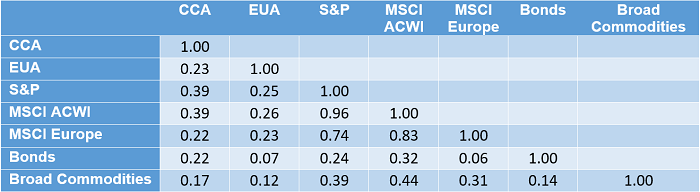
CCA = Solactive California Carbon Rolling Futures TR Index; EUA = Solactive Carbon Emission Allowances Rolling Futures TR Index; S&P = S&P 500 Total Return Index; MSCI ACWI = MSCI All Country World Index (includes developed and developing countries); Commodity = Bloomberg Commodity Total Return index; MSCI Europe = MSCI Europe Total Return; Global Aggregate Bond = Bloomberg Global Aggregate Index TR Index
Weekly returns from 02/01/2015 to 16/06/2023, based in unhedged local currency
Source: WisdomTree, Bloomberg, Includes backtested data. Solactive California Carbon Rolling Futures TR Index live date is 14/12/2022 and backtest has been calculated inhouse. Solactive Carbon Emission Allowances Rolling Futures TR Index live date is 03/08/2021. You cannot invest directly in an index.
Historical performance is not an indication of future performance and any investments may go down in value.
Pushing out the frontier
Markowitz introduced the concept of an efficient frontier. Increasing risk (measured by standard deviation of returns) is usually associated with higher expected returns. Portfolio allocations that generate higher risk without higher returns are inefficient. In Figure 2, each dot represents a portfolio combination and plots the risk (in standard deviations) and expected annualised returns. The edge of the scatter plot of risk and return represents the ‘efficient frontier’. The dark blue dots are a portfolio of equities, bonds and commodities with varying degrees of weights (and commodities are capped at 30% of the portfolio).
If we add EUAs to that portfolio (with a max weight of 5%), that shifts the entire scatter plot upwards and to the left, with the edge being markedly higher. That is, for each level of risk, there is a higher return profile when including EUAs. For example, for a portfolio volatility of 10%, you could increase your expected returns to 4.97% from 4.09% by adding EUAs (Figure 3).
Adding CCAs to that portfolio (with a max weight of 5%) also shifts the plot upwards, but by a marginal incremental amount. Because of CCAs’ low correlation with EUAs, there is still some benefit to adding it to a portfolio in addition to EUAs. For example, for a portfolio volatility of 10%, you could increase your expected returns to 5.02% (from 4.97%) by adding CCAs to a portfolio of equities, bonds and EUAs.
Figure 2: Mean-variance analysis with carbon markets
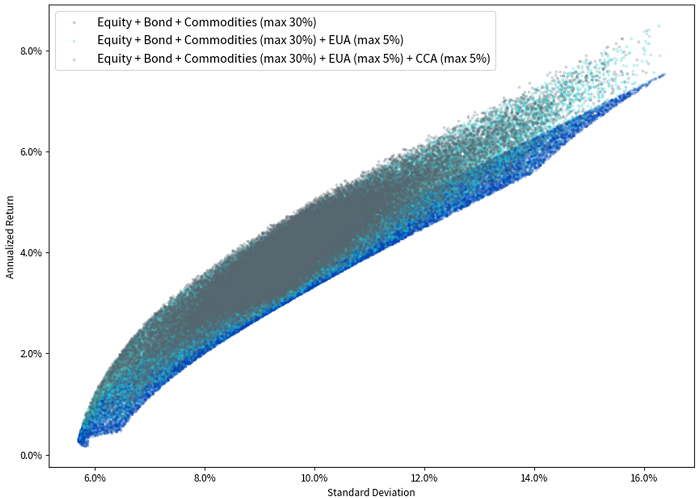
CCA = Solactive California Carbon Rolling Futures TR Index (SOLCARBT). EUA = Solactive Carbon Emission Allowances Rolling Futures TR Index (SOLCCATR).Equity = refers to the MSCI ACWI Net Total Return (NDUEACWF). Commodity = Bloomberg Commodity Total Return index (BCOMTR). Bond = Bloomberg Global Aggregate Index TR Index (LEGATRUU).
Weekly returns from 01/01/2015 to 30/04/2023, based in USD unhedged.
Source: WisdomTree, Bloomberg, Includes backtested data. Solactive California Carbon Rolling Futures TR Index live date is 14/12/2022 and backtest has been calculated inhouse. Solactive Carbon Emission Allowances Rolling Futures TR Index live date is 03/08/2021. You cannot invest directly in an index.
Historical performance is not an indication of future performance and any investments may go down in value.
Figure 3: Expected returns on portfolio at different levels of risk and portfolio composition
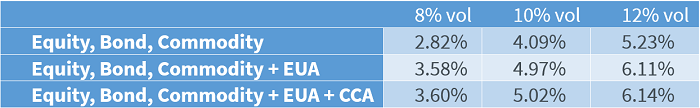
CCA = Solactive California Carbon Rolling Futures TR Index (SOLCARBT). EUA = Solactive Carbon Emission Allowances Rolling Futures TR Index (SOLCCATR). Equity = refers to the MSCI ACWI Net Total Return (NDUEACWF). Commodity = Bloomberg Commodity Total Return index (BCOMTR) Bond = Bloomberg Global Aggregate Index TR Index (LEGATRUU).
Weekly returns from 01/01/2015 to 30/04/2023, based in USD unhedged.
Source: WisdomTree, Bloomberg, Includes backtested data. Solactive California Carbon Rolling Futures TR Index live date is 14/12/2022 and backtest has been calculated inhouse. Solactive Carbon Emission Allowances Rolling Futures TR Index live date is 03/08/2021. You cannot invest directly in an index.
Historical performance is not an indication of future performance and any investments may go down in value.
Conclusions
Diversifying with low correlation assets provides the only ‘free-lunch’ in the world of investing. Carbon markets have a very low level of correlation with traditional assets and, therefore, make great candidates for diversification. The various carbon markets around the world also have a low level of correlation between themselves meaning several carbon markets could be considered for inclusion.
Sources
1 Markowitz, Harry. “Portfolio Selection.” The Journal of Finance, vol. 7, no. 1, 1952, pp. 77–91. JSTOR.
2 For a fuller description of carbon markets please visit: https://www.wisdomtree.eu/en-gb/strategies/carbon.
3 Source: Refinitiv Carbon Market Year in Review 2022, published February 2023.
Related blogs
+ What’s Hot: Fit for 55 on the cusp of becoming law
+ California Carbon Allowances have the potential to help the state meet higher climate targets